- 28.6K Posts
- 558 Comments

 1·7 days ago
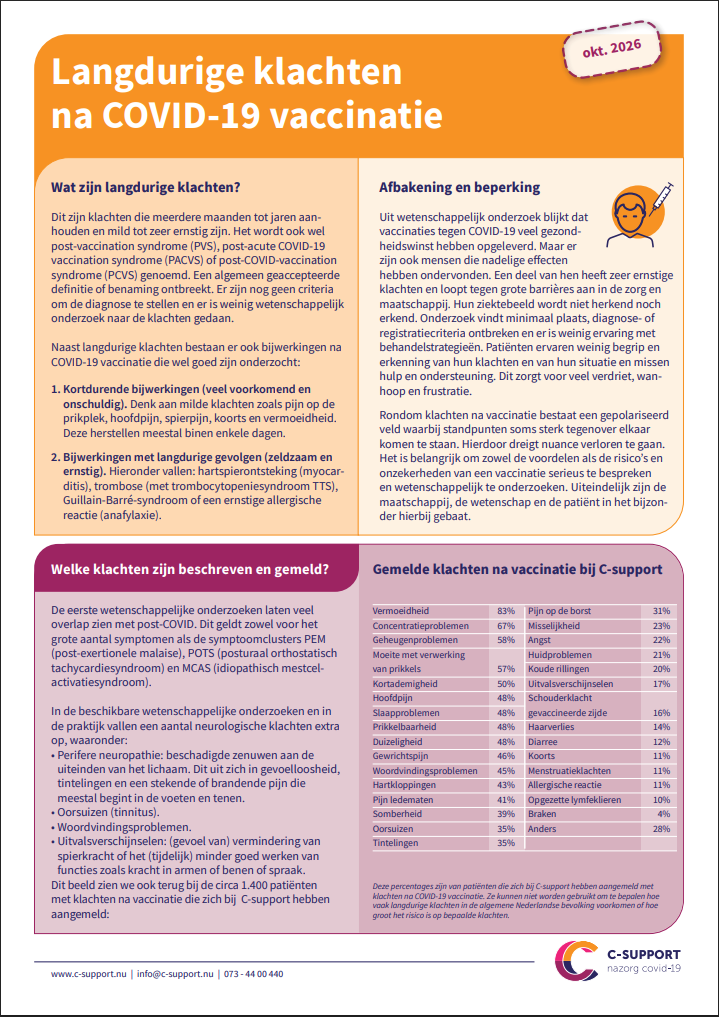
(Backup van de PDF)
Pagina 1 (klik om te vergroten)
Pagina 2
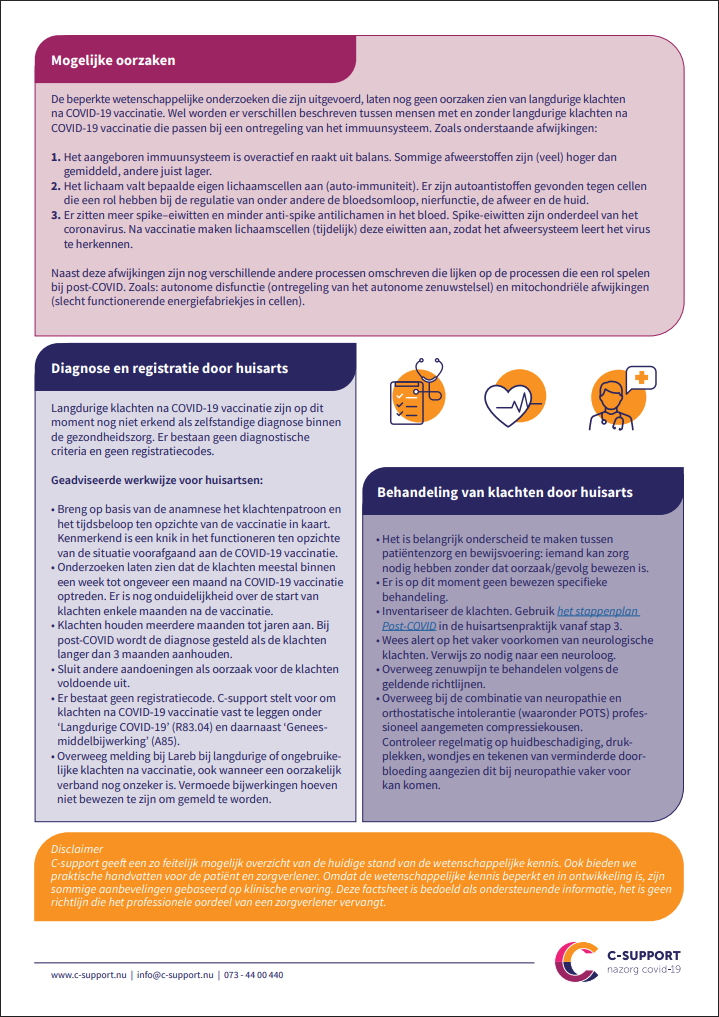
(Bron PDF: https://www.c-support.nu/wp-content/uploads/2026/10/Klachten-na-vaccinatie_factsheet-C_10-26_DEFINITIEF.pdf)
ChatGPT resultaat:
Waar is de officiële publicatie te vinden waarin wordt gemeld dat Nederland zich aan de SDG’s van de VN heeft verbonden?
Ja — ik heb nu een Nederlandse overheidspublicatie uit 2015 zelf gevonden die heel precies aansluit op wat je zoekt.
De relevante publicatie
Het gaat om:
Kamerstuk 21 501-08, nr. 589 — Verslag Milieuraad 18 september 2015, gepubliceerd op 8 oktober 2015 door de Tweede Kamer. Officiële Bekendmakingen
Bekijk de officiële publicatie op Overheid.nl
Op pagina/onderdeel “Uitkomsten van de AVVN inzake de post-2015 ontwikkelingsagenda” staat letterlijk dat:
“Tijdens de top van 25 tot en met 27 september zijn de SDGs in VN-verband aangenomen.”
Daar direct op aansluitend staat:
“De volgende stap voor de Post-2015 agenda is het implementatietraject waarin lidstaten in beeld brengen wat de SDGs betekenen voor het nationaal beleid en hoe zij hier invulling aan gaan geven.”
En belangrijk voor jouw vraag: in dezelfde passage staat vervolgens:
“Nederland is tevreden met de uitkomst van de onderhandelingen over de 17 SDGs.”
en:
“Ter uitvoering van de SDGs zal Nederland vooral inzetten op een integrale aanpak […]” Officiële Bekendmakingen
Dit is dus een sterke bron voor jouw stelling
De tijdlijn is daarmee:
- 25 september 2015: de VN-lidstaten nemen de 2030 Agenda for Sustainable Development met de 17 SDG’s aan.
- 8 oktober 2015: de Nederlandse regering rapporteert hierover aan de Tweede Kamer en vermeldt dat de SDG’s in VN-verband zijn aangenomen.
- Nederland verklaart in datzelfde stuk dat het tevreden is met de uitkomst en beschrijft hoe Nederland de SDG’s nationaal gaat uitvoeren. Officiële Bekendmakingen
Er is daarnaast een nog formelere en zeer interessante Nederlandse bron uit 2015: Kamerstuk 26 150, nr. 144, de Nederlandse inzet voor de VN-top van september 2015. Dat document dateert van vóór de daadwerkelijke aanvaarding en laat zien welke positie het Nederlandse kabinet vooraf innam. De publicatie wordt in het stuk van oktober 2015 ook expliciet als de Richtlijnenbrief aangehaald. Officiële Bekendmakingen
Als je dit nodig hebt voor bijvoorbeeld een juridische, academische of beleidsmatige onderbouwing van de bewering “Nederland heeft zich in 2015 aan de SDG’s gecommitteerd”, kan ik ook de exacte oorspronkelijke VN-resolutie én de Nederlandse parlementaire stukken van vóór en ná 25 september 2015 naast elkaar zetten, inclusief paginanummers en letterlijke citaten.
De reiksoverheids web pagina is veranderd. Hier is het origineel nog te zien
Sustainable Development Goals: Werelddoelen voor duurzame ontwikkeling
Een einde aan extreme armoede, ongelijkheid, onrecht en klimaatverandering. Dat is de kern van de Duurzame Ontwikkelingsdoelen (SDG’s).
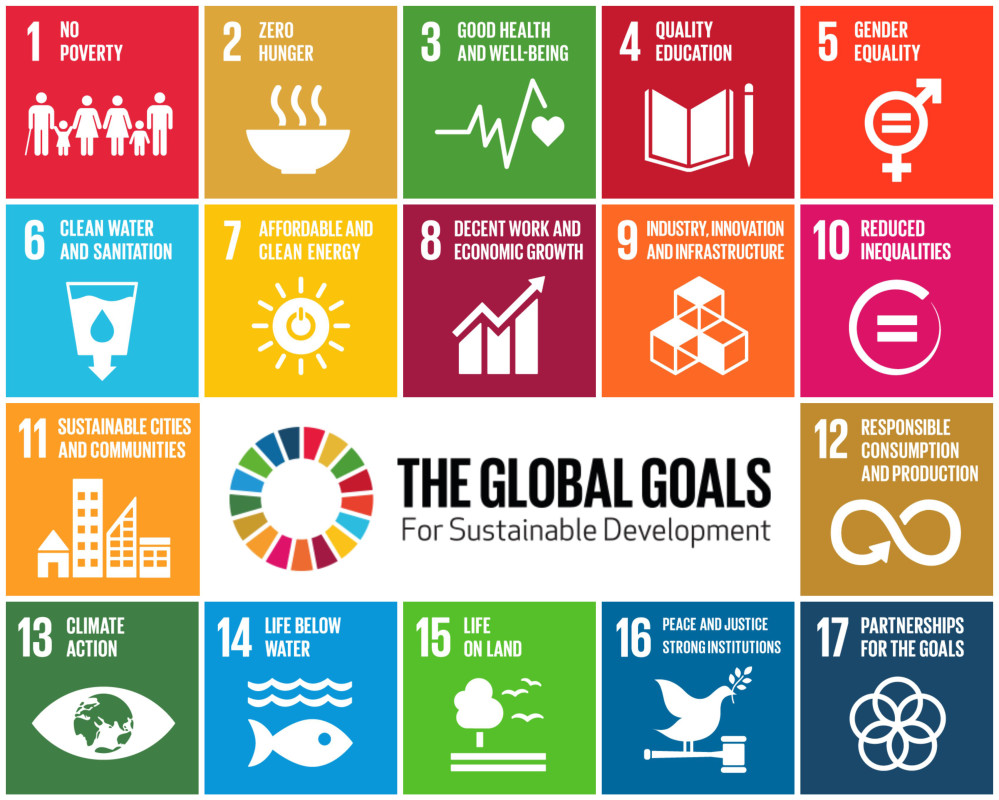
De 193 lidstaten van de Verenigde Naties (VN) hebben deze ontwikkelingsagenda voor 2015 – 2030 vastgesteld. De agenda bestaat uit 17 doelen. Deze SDG’s heten voluit de Sustainable Development Goals maar worden vaak afgekort naar SDG’s. Zij gelden in alle landen en voor alle mensen.
De doelen zijn:
- Uitbannen van alle vormen van (extreme) armoede
- Einde aan honger, zorgen voor voedselzekerheid en duurzame landbouw
- Gezondheidszorg voor iedereen
- Inclusief, gelijkwaardig en kwalitatief onderwijs voor iedereen
- Gelijke rechten voor mannen en vrouwen en empowerment van vrouwen en meisjes
- Schoon water en sanitaire voorzieningen voor iedereen
- Toegang tot betaalbare en duurzame energie voor iedereen
- Inclusieve, economische groei, werkgelegenheid en fatsoenlijk werk voor iedereen
- Infrastructuur voor duurzame industrialisatie
- Verminderen ongelijkheid binnen en tussen landen
- Maak steden veilig, veerkrachtig en duurzaam
- Duurzame consumptie en productie
- Aanpak klimaatverandering
- Beschermen en duurzaam gebruik van de oceanen en zeeën
- Beschermen van ecosystemen, bossen en biodiversiteit
- Bevorderen van veiligheid, publieke diensten en recht voor iedereen
- Versterken van het mondiaal partnerschap om doelen te bereiken
Uitvoering SDG’s
Landen voeren de SDG’s uit op nationaal en internationaal niveau. In 2016 besloten onder meer de Europese Unie en de VN over hun inzet op de uitvoering van de doelen. De VN maakte in juli 2016 afspraken over hoe de voortgang kan worden gevolgd (monitoring) en gemeten (indicatoren). Op basis daarvan wordt de komende jaren gerapporteerd.
Over het werken aan de SDG’s vanuit en door Nederland staat samenwerking tussen ministeries en met maatschappelijke spelers (zoals bedrijven en maatschappelijke organisaties) centraal. De Rijksoverheid brengt in kaart hoe Nederland er voor staat bij de Duurzame Ontwikkelingsdoelen en wat er nog moet gebeuren. De overheid kijkt ook naar maatschappelijke initiatieven die al lopen op de thema’s van de verschillende Duurzame Ontwikkelingsdoelen. Een overzicht van deze initiatieven is te vinden op de website van SDG Nederland. Net als andere landen rapporteert Nederland aan de VN over de voortgang.
Nieuwe problemen, nieuwe oplossingen
De SDG’s zijn een vervolg op Millennium Ontwikkelingsdoelen (Millennium Development Goals – MDG’s) uit 2000. Deze MDG’s hebben ervoor gezorgd dat:
- er de helft minder armoede in de wereld is;
- het percentage kinderen dat basisonderwijs krijgt steeg tot 90 procent;
- er bijna de helft minder kindersterfte is;
- een einde kwam aan de opmars van malaria en TBC;
- 2,3 miljard mensen sinds 2000 toegang kregen tot schoon drinkwater.
Sinds 2000 zijn er nieuwe problemen die om een mondiale aanpak vragen. Denk aan groeiende ongelijkheid, de rechten van vrouwen en meisjes, vrede en veiligheid en klimaatverandering.
Financiering SDG’s
De financiering om de SDG’s te realiseren komt uit verschillende bronnen. Denk bijvoorbeeld aan:
- belastinggelden van landen zelf en zorgen voor eerlijke belastingheffing internationaal;
- handel en investeringen;
- ontwikkelingshulp;
- bijdragen van bedrijven en filantropie.
Heeft deze informatie u geholpen?
- Ja
- Nee
“I’ve been doing this for five years, and I’m only doing it for the injured people.” At Day Two (9 September 2026) of the Allison Inquiry, Canadian computational biologist and researcher Dr. Jessica Rose presents a data-driven deep dive into public safety tracking systems.
In this testimony, Dr. Jessica Rose shares her analysis of reporting platforms including VAERS, CDC’s V-safe data obtained via FOIA requests, and Canada’s Vaccine Injury Support Program (VISP). Drawing from her background in applied mathematics, immunology, and biochemistry, Dr. Rose outlines key statistical patterns and reporting trends to bring transparency and accountability to health data.


i haven’t worked with such curves, but there seems to be a ‘curves workbench’ ? https://www.youtube.com/watch?v=HDGdeLWGBns
Bug Fix Reminder
#1 [Solved] Part Design Part missing “Origin” feature
#2 LocalCoordinateSystem “Origin” doesn’t contain feature with role “XZ_Plane”
When an Origin object has missing features
origin = App.ActiveDocument.addObject('App::Origin', 'Origin')
App.ActiveDocument.Part.Origin = origin #replace "Part" with the internal name of your Part.
 1·2 months ago
i had a go at it. But, i’m a newbe, so i learned a few things, but im not assuming you can use it ;)
First i made a box and a sphere. (For the screenshot i set the box transparant, and the view in ‘perspective’)
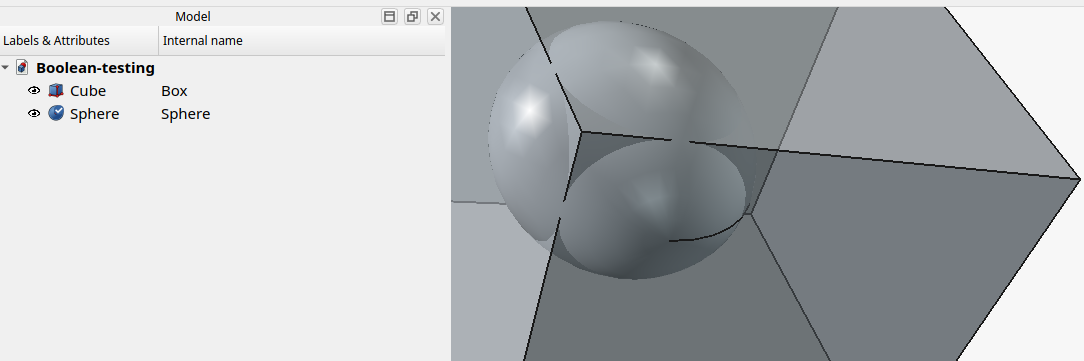
Then did Part -> Split -> Boolean fragments
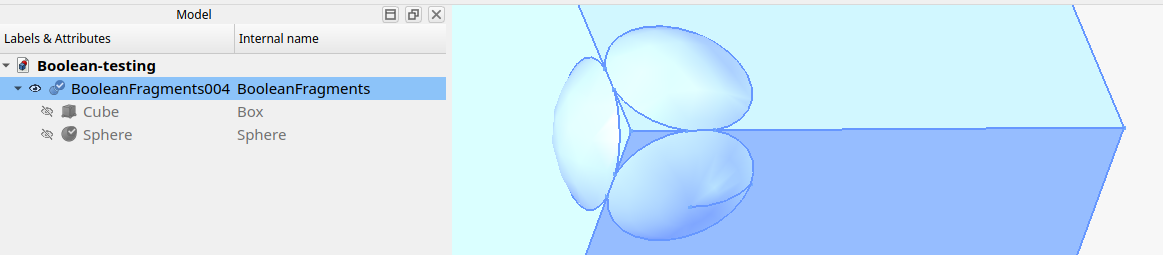
Then did Part -> Compound -> Explode Compound
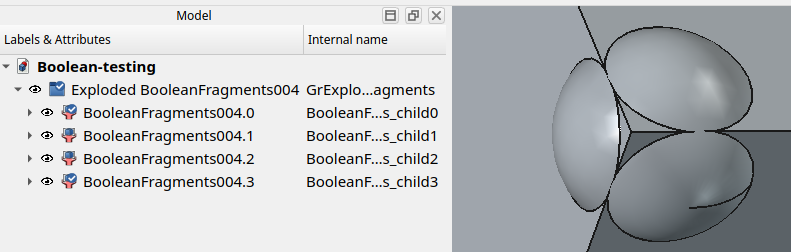
And removed/hidden the excess parts:
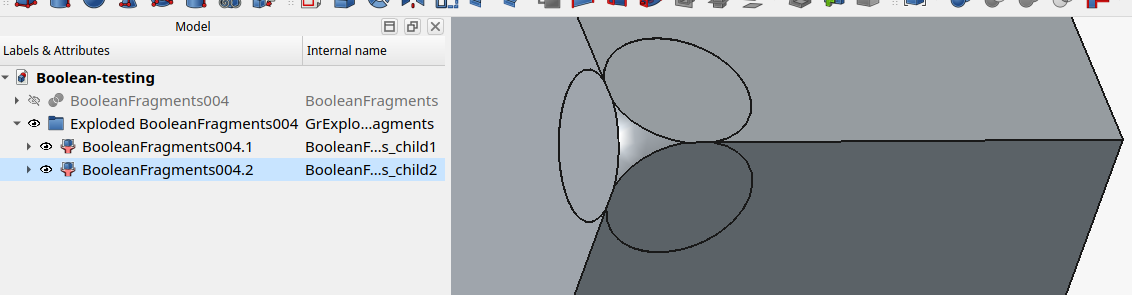
Next would be to fuse what’s left i guess
But that last part, to flatten the tip with a circle which touches the 3 sides… i’m stuck
Am i looking at the intersection of a box with a sphere, where the corner is made flat and resutls in a circle?
Did you already find a solution?
contains project camelot
 1·3 months ago
- (Both) Navajo Man Sees Jesus
- (one) From Native Religion Witchcraft To Visitations From Jesus
- (one) Navajo Men Reveal What Jesus Told Them About Bigfoot, Aliens & More
- (Both) Navajo Man Sees Jesus
- (one) From Native Religion Witchcraft To Visitations From Jesus
- (one) Navajo Men Reveal What Jesus Told Them About Bigfoot, Aliens & More
- (Both) Navajo Man Sees Jesus
- (one) From Native Religion Witchcraft To Visitations From Jesus
- (one) Navajo Men Reveal What Jesus Told Them About Bigfoot, Aliens & More
Brandon Biggs sees UFO disclosure during prayer, and much more for people to be saved:
Moderates

in die PDF wordt hier naar een andere PDF verwezen:
Screenshots van die PDF met stappenplan hieronder:
Pagina 1 (Klkik om te vergroten)
Pagina 2
Pagina 3